

You have just spit into a tube, sealed it with a grimace, and mailed your genetic destiny to a laboratory. Weeks later, the results arrive, and you are transported: 42% Scandinavian, 18% Italian, a dash of Ashkenazi Jewish. You are from somewhere, the test assures you. You can finally tell your friends at brunch that your ancestral homeland is, in fact, a fjord in Norway. But before you book that Viking-themed cruise, consider the fine print—that microscopic, deliberately opaque wall of legal prose that every consumer blithely clicks through. It does not say: “We have conclusively determined your origins.” It says, in careful, legally vetted language: “Your ancestry results are estimates based on reference populations and are for informational and educational purposes only.” In other words, the company that just sold you a fantasy of genetic belonging has, in the very same transaction, legally disclaimed that fantasy. It is a beautiful, absurd dichotomy: the marketing screams “You are your DNA,” while the lawyers whisper, “Not really, though.” As we will demonstrate, the 23andMe experience is not a window into your past; it is a Rorschach test for your modern identity, built on a foundation of nomenclatural chaos, unexamined assumptions, and a profoundly misleading conflation of social structure with biological movement.
A proper critique of the mtDNA narrative must address the foundation upon which all those grand stories of migration are built: the molecular clock. Without it, the dates and routes—the Out of Africa event at ~65,000 years ago, the peopling of the Americas, the spread of Neolithic farmers—are just untethered speculation. The problem is that the clock is broken, and the very features that make mtDNA “useful” are the same features that make it unreliable.
The Engine of Mutation: D-Loop and Non-Coding Regions
The human mitochondrial genome is a small, 16,569 base-pair circle of DNA. Nestled within it is a tiny, non-coding segment called the control region, or D-loop. This region doesn’t code for proteins; its primary function is to regulate the replication and transcription of the mitochondrial genome. Because it’s non-coding, it is free from the intense evolutionary pressure that conserves protein-coding sequences. As a result, the D-loop, and particularly its three hypervariable regions (HVI, HVII, and HVIII), is a mutational hot spot. These regions accumulate mutations at a rate that is 5 to 10 times faster than nuclear DNA, with some estimates placing the rate at 100 to 200 times faster. The D-loop’s high mutation rate, driven by transition-type substitutions, is precisely why it became the favored tool for population geneticists—it provides the “resolution” needed to distinguish between closely related lineages. But as we will see, this high resolution is a double-edged sword.
The Broken Clock: Pedigree vs. Phylogeny
The molecular clock is the assumption that DNA mutations accumulate at a roughly constant rate, like the ticking of a clock. This assumption is the bedrock of all mtDNA dating. However, a fundamental and unresolved discrepancy lies at the heart of mitochondrial dating: the pedigree rate versus the phylogenetic rate.
Pedigree rates are measured by directly sequencing the mtDNA of parents and their children across known generations. These studies, such as those by Parsons et al. (1997) and the recent deCODE study by Helgason et al. (2024), consistently find a very fast mutation rate—roughly one mutation in the control region every 33 generations. This rate is 10 to 20 times faster than phylogenetic estimates. As one analysis notes, these pedigree rates fall within “a timescale consistent with the Biblical chronology, not the deep-time evolutionary model”.
Phylogenetic rates, on the other hand, are calculated by comparing the DNA of different species (e.g., humans and chimpanzees) and calibrating against fossil dates. These rates are much slower. To resolve this, researchers have proposed a “time-dependent” rate, suggesting the clock ticks faster over short timescales and slows down over millions of years due to the purging of harmful mutations.
This is not a settled debate. Even a 2009 study attempting to recalibrate the clock acknowledged that the distribution of mutations “significantly departs from a model assuming a single rate parameter”. If the clock’s rate is not constant, but varies over time and between different parts of the genome, then every date assigned to a migration event is built on shifting sands.
A House of Cards: Somatic Mutations and Age
The clock’s instability is further compounded by a phenomenon that is almost never discussed in popular ancestry narratives: somatic mutations. These are mutations that occur in the cells of an individual’s body during their lifetime, as opposed to germline mutations that are passed on to offspring. Somatic mtDNA mutations are now known to accumulate exponentially during aging. This accumulation is so pronounced that it is considered a “strong signature of aging”. This means that the mtDNA in the blood of a 70-year-old is demonstrably different from the mtDNA they were born with.
The implications for the molecular clock are devastating. The “mutations” counted by a phylogenetic clock are assumed to be germline events, faithfully passed from mother to child. But if a significant portion of the mutations observed in a population sample are actually somatic variants that arose in the tissues of the individuals being studied, the clock’s ticking is no longer a measure of evolutionary time. It becomes a measure of biological age, cellular stress, and disease. It conflates the history of a population with the health of its sampled individuals. This is a confounding variable of the highest order, yet it is rarely, if ever, accounted for in standard phylogenetic analyses.
The Great Irony of the Genetic Revolution
Here is a cosmic joke: the very molecule that millions of people have spat into a tube to discover their “ancestral identity” is, in its most heavily scrutinized regions, a biological wasteland. The mitochondrial genome is a ghost ship—a 16,569-base-pair relic that floats through our cells, carrying the memory of a billion-year-old bacterial symbiont. And the parts of it that geneticists treasure most—the hypervariable regions of the D-loop—are the equivalent of an abandoned warehouse: no function, no purpose, no phenotypic value whatsoever. Yet we have built entire civilizations of interpretation on this emptiness.
The Great Nothing: Hyper-variable Regions
Let’s be precise. The mitochondrial genome contains a small, non-coding stretch called the control region, or D-loop. This region regulates replication and transcription—administrative housekeeping for the mitochondrial machinery. Within this administrative zone sit three hypervariable segments: HVI, HVII, and HVIII.
These regions are the favorite playthings of population geneticists. They mutate at a prodigious rate—5 to 10 times faster than nuclear DNA, and in some estimates, 100 to 200 times faster. This is because they are non-coding, and therefore free from the evolutionary constraints that preserve functional sequences.
This is the foundation of your ancestry result.
When you send your spit to 23andMe, the company sequences these hypervariable regions. They count the mutations—the transitions, the substitutions, the silent changes that have accumulated in the genetic wilderness of your D-loop. They compare your pattern of mutations to reference populations. And from this, they construct a narrative: “You are 42% Scandinavian. Your maternal lineage traces to a woman who lived in the European steppe 5,000 years ago. You are a Viking. You are a Celt. You are a child of the ancient world.”
But let us be clear about what those mutations actually are: they are genetic noise, unmoored from any functional significance, accumulating in a biological dead zone, completely silent in their phenotypic effect. You could replace every hypervariable nucleotide in your mtDNA with a random sequence, and you would remain entirely human, entirely you, indistinguishable in health, appearance, or ability.
The Phenotypic Void: Mutations That Change Nothing
This is where the marketing fantasy collides with biological reality.
The mutations tracked by population geneticists in the hypervariable regions do not:
Alter your metabolism
Affect your susceptibility to disease
Change your physical appearance
Influence your cognitive abilities
Determine your athletic potential
Impact your longevity
They are functionally inert. They are the genetic equivalent of changing the font on a page—the text remains identical, the meaning unchanged, the reader unaffected. Yet these silent, meaningless changes are the basis for assigning you to haplogroups, to populations, to “ancestral” identities.
Consider the arrogance of the inference: we claim to know the migration routes of human populations from mutations that occur in regions of the genome that do nothing. We claim to trace the peopling of continents from genetic changes that have zero phenotypic consequence. We claim to reconstruct human history from biological waste.
The Great Disconnect
Your true biological heritage—your nuclear genome, the 3.2 billion base pairs that actually make you human, that determine your height, your risk of heart disease, your eye color, your susceptibility to cancer, your very existence—is almost entirely ignored in these ancestry reports. The nuclear genome is the cathedral. The mtDNA is the gift shop.
This is the scandal of consumer ancestry testing: the product promises to tell you who you are, but it looks at the part of your genome that has nothing to do with who you are. It sells you a narrative of identity based on mutations that are functionally silent. It traces your “ancestral” lineage through a genome that comes from your mother alone—ignoring the 22 other chromosomes from your mother and the entire 23 chromosomes from your father, all of which are vastly more informative about your biology.
The result is a beautiful, compelling, and entirely misleading fiction.
We have allowed the genetic equivalent of wallpaper to define our sense of self. And in doing so, we have missed the most important lesson of all: who you are is not written in the silent mutations of a mitochondrial non-coding region. It is written in the living, breathing, functional genome that shapes every aspect of your existence.
The hypervariable regions of the D-loop are fascinating. They are useful for tracking maternal lineages. They are powerful tools for population genetics. But they are not, and will never be, a source of identity.
It is a lie.
Not a lie of malice, but a lie of convenience—a simplifying assumption that has calcified into dogma. The truth, as we shall demonstrate, is far more subversive: mtDNA does not record biology. It records social structure.
The Nomenclutter
Now we must confront the foundation upon which all mtDNA analysis rests. The current nomenclature is not a rational phylogenetic system. It is a historical accident.
As Bajić and colleagues document in their landmark 2024 paper, mtDNA “nomenclutter” and its consequences on the interpretation of genetic data, the system is a mess. Population studies require the classification of mtDNA haplotypes into more than 5,400 described haplogroups, and these are further grouped into hierarchically higher categories. The problem? “Retention of historical nomenclature coupled with a growing number of newly described mtDNA lineages results in increasingly complex and inconsistent nomenclature that does not reflect phylogeny well”. The authors do not mince words: this “clutter” leaves room for “grouping errors and inconsistencies across scientific publications” and represents “a source for scientific misinterpretation”.
Why is the nomenclature so broken? Because haplogroups were named in the order of their discovery, not their position on the evolutionary tree. The alphabetical ordering of mtDNA—A, B, C, D—has no phylogenetic meaning. It is a catalog of discovery, not a map of descent. As Bajić et al. bluntly state, “the current mtDNA nomenclature mostly reflects the history of research, and not necessarily the nested phylogenetic structure of the mtDNA tree”.
The consequences are catastrophic. Bajić and colleagues demonstrate that frequency-based analyses produce inconsistent results when different secondary mtDNA groupings are applied, allowing for “vastly different interpretations of the same genetic data”. The lack of standardized groupings undermines “the interpretation of results, as well as their comparison and reproducibility across studies”.
Again, when researchers move beyond the basic “H” or “U5” label on a consumer report, they enter the messy world of secondary haplogroup groupings—the arbitrary way scientists lump those 5,400+ lineages into broader categories for analysis. Currently, this is a free-for-all. As Bajić and colleagues document, these secondary groupings (e.g., “macro-haplogroups”) vary wildly between studies, depending on sample quality, the researcher’s understanding of the nomenclature, and even the specific software used. This lack of standardization is not a minor technicality; it is a scientific liability, as frequency-based analyses produce inconsistent results when different secondary groupings are applied, allowing for vastly different interpretations of the same genetic data.
To cut through this “clutter”, Bajić et al. propose a radical re-organization: a standardized, algorithm-based three-tier system of macro-haplogroups, meso-haplogroups, and micro-haplogroups. Using a tool called TreeCluster, these groupings would be defined by phylogenetic similarity rather than historical accident, ensuring each level is informative about a distinct scale of human population history. This proposed system, which could be integrated directly into haplogroup callers like HaploGrep3, would foster reproducibility and reduce the biases that currently plague the field. The goal is to replace subjective, tradition-bound decisions with a phylogenetically meaningful standard.
The Sedentary Myth: When Assumption Becomes Dogma
The nomenclutter is bad enough. But it is compounded by a far more insidious assumption: the sedentary model of female behavior.
The logic is as follows: mtDNA is passed only from mother to child. Therefore, if we observe geographic clustering of mtDNA lineages, it must mean that women stayed put while men moved. Higher female-than-male migration is predicted to result in lower between-group differentiation for mtDNA than for the Y chromosome. Patrilocality—women moving to join their mate’s paternal relatives—has been invoked to explain patterns of mtDNA diversity across the globe.
The inference seems reasonable. It is also profoundly flawed.
First, the assumption of female sedentism is untested. Researchers have assumed that women were the stay-at-home half of humanity, while men roamed, traded, raided, and conquered. This is not a finding. It is a projection—a Victorian-era gender stereotype extrapolated into population genetics. As one analysis notes, “the claim of patrilocality rests on the observation that three adult males all have the same mtDNA haplotype, whereas three adult females each carry a different mtDNA lineage”—yet this observation “is not an indication of patrilocality, however, because males simply carry the mtDNAs of their mothers”.
In other words, the very data used to infer patrilocality can be explained by the biology of inheritance alone.
Second, the scale problem is ignored.
Patrilocality may be important at the local scale, but “patterns of genetic structure at the continental and global scales are not shaped by a higher rate of migration of females versus males”. The assumption that local marriage practices scale to global population movements is a category error.
Third, the model is self-reinforcing.
Researchers observe mtDNA diversity, assume it reflects female migration, use it to infer patrilocality, and then use patrilocality to explain mtDNA diversity. This is not science. It is a tautology dressed in statistical language.
The result is a framework in which every genetic pattern is interpreted through the lens of a simplistic behavioral assumption, and that assumption is never tested because the data used to test it is the same data that generated it.
The Migration Inference: A Thought Experiment in Catastrophic Misreading
Now we arrive closer to the heart of the lie. Consider the following scenario:
Tribe 1 and Tribe 2 are neighboring groups. A male from Tribe 1 has a daughter with a female from Tribe 2. That daughter—let us call her Generation 2—carries Tribe 2 mtDNA, but her nuclear genome is a 50/50 mix of both tribes. Her phenotype—her height, her metabolism, her disease susceptibility, her biological identity—is a product of both lineages.
Now Generation 2 has a daughter with a male from Tribe 1. That granddaughter—Generation 3—still carries Tribe 2 mtDNA. But her nuclear genome is now 75% Tribe 1, 25% Tribe 2. Phenotypically, she is indistinguishable from a pure Tribe 1 individual. Yet her mtDNA screams “Tribe 2.”
Now suppose this pattern repeats. After just a few generations, an entire population can carry Tribe 2 mtDNA while being overwhelmingly Tribe 1 in every biological sense. Their phenotype, their disease risks, their adaptive traits—all are Tribe 1. Their mtDNA is a fossil, a relic of a single maternal ancestor who married into the group generations ago.
The archaeologist arrives. She sequences the mtDNA. She finds Tribe 2 lineages in a Tribe 1 region. She concludes: “Tribe 2 people migrated here.”
She is wrong.
No one migrated. No population moved. No invasion occurred. All that happened was a series of marriages—social transactions that left a genetic signature entirely divorced from biological reality.
This is not a hypothetical. This is a daily occurrence in the interpretation of ancient DNA. As Bajić et al. warn, “the lack of guidelines and recommendations on how to choose appropriate secondary haplogroup groupings presents an issue for the interpretation of results, as well as their comparison and reproducibility across studies”. When the groupings themselves are arbitrary, how much more arbitrary are the inferences drawn from them?
The field’s reliance on mtDNA to infer female migration is based on a logical fallacy: that a genetic lineage’s presence in a new location means the person carrying it traveled there. But as my scenario shows, a lineage can appear through marriage networks without any single person migrating.
This is why the most rigorous aDNA studies now treat mtDNA as one line of evidence among many, and explicitly model social structures (patrilocality, matrilocality, polygyny) as variables—not assumptions.
The real revolution won’t come from more data; it will come from abandoning the biological metaphor of “migration” and adopting the social metaphor of “alliance.”

The Collapse of the Phenotype Inference
The implications are devastating.
If mtDNA reflects marriage patterns, not migration, then every inference about phenotype—about adaptation, about selection, about the spread of advantageous traits—is built on quicksand. When we see a new mtDNA lineage appearing in a region, we cannot know if it represents:
A population migration (biological movement)
A marriage alliance (social movement)
A shift in marriage preferences (social change with no movement)
A change in fertility among mixed offspring (biological outcome of social structure)
Sampling bias (we just happened to find the one matriline that married in)
These alternatives are not distinguishable from mtDNA alone. The signal is identical. The inference is entirely dependent on assumptions that are rarely stated and never tested.
Consider the grand narratives of human prehistory:
The Out of Africa migration: Built on mtDNA, assumes that the distribution of L haplogroups reflects population movement. But what if it reflects marriage networks among early African foragers?
The Neolithic transition in Europe: Interpreted as demic diffusion—farmers replacing hunter-gatherers. But what if it reflects a shift in marriage patterns, with farming women marrying into hunter-gatherer groups and bringing their agricultural knowledge with them?
The Steppe expansions: Framed as massive population replacements. But what if they were elite emulation networks, with a small number of high-status women carrying Steppe mtDNA into local populations?
Each of these alternatives is biologically plausible. Each would produce the same mtDNA patterns. Each would require completely different interpretations of human history.
Cultural Shifts Get Misattributed to Population Replacement
Imagine a cultural shift occurs—new pottery, new burial rites, new language—accompanying the appearance of a new mtDNA lineage defined by mutations in the non-coding, hypervariable regions of the D-loop, those silent stretches of the mitochondrial genome that have no functional significance and no phenotypic effect.
The assumption: New mtDNA = new people = new culture arrived (demic diffusion).
The reality: That new mtDNA lineage could be from one woman who married into the group and brought her cultural practices with her. The mutations that define her lineage are functionally inert—they change nothing about her biology, her appearance, her capabilities. She is biologically indistinguishable from the women of her new community, but her mtDNA carries the ghost of her mother’s lineage. Her daughters and granddaughters adopt the new culture, but the population is largely the same people.
The havoc: We infer a massive migration when the reality is cultural transmission through female exogamy—a social phenomenon that leaves a genetic trace in the biological emptiness of the non-coding regions, a trace that has everything to do with marriage patterns and nothing to do with population movement. The entire “Steppe invasion” narrative, for instance, could be largely explained by a few influential women carrying their customs into new groups—without any significant population movement. The mtDNA signal we have interpreted as a demographic tsunami is, in fact, a record of who married whom, etched into the silent, non-functional regions of the mitochondrial genome.
This is not a marginal possibility. It is a structural feature of mtDNA analysis. The mutations we track, the haplogroups we define, the migrations we infer—all are built on genetic changes that have no phenotypic consequence, no biological meaning, and no necessary connection to population movement. They record social structure, not biology. And until we accept that, we will continue to mistake the ghost for the machine.
The Great Divide: L to M to N
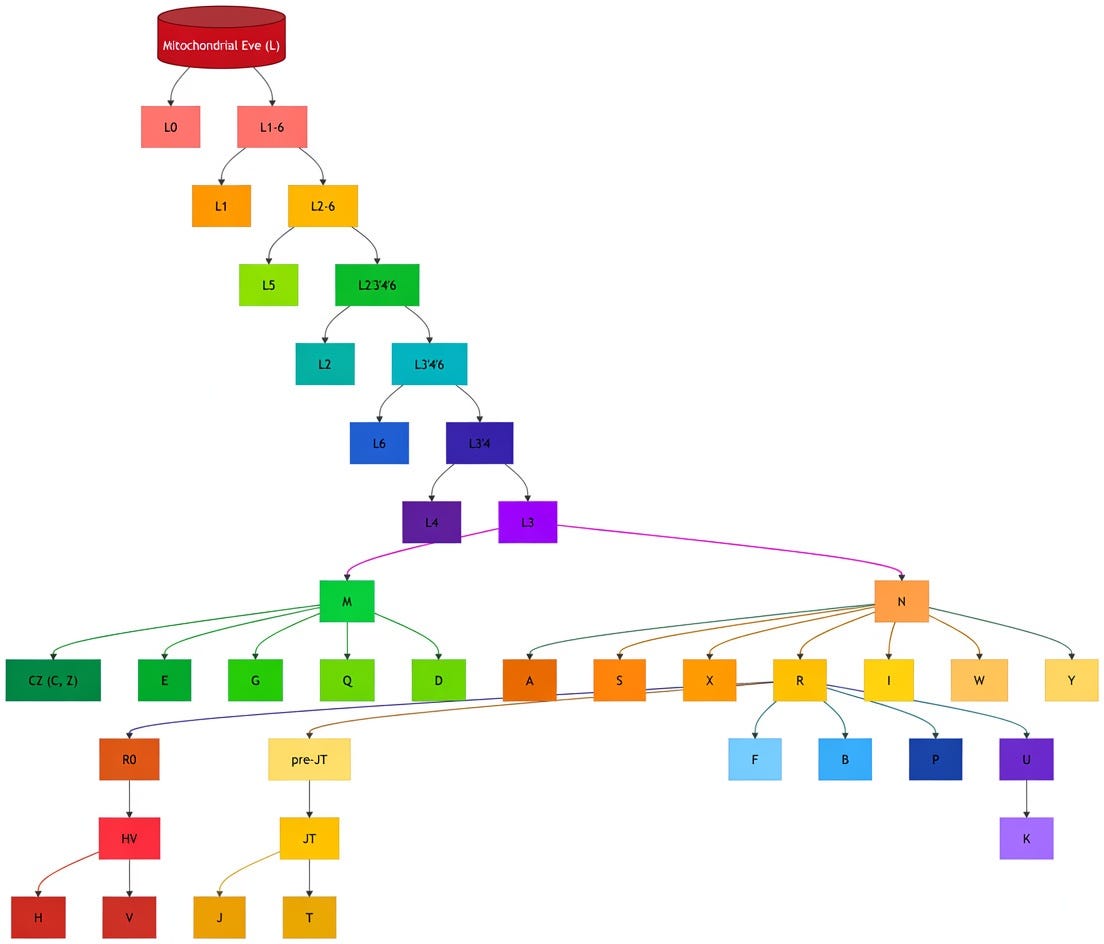
The most sacred narrative in human population genetics—the exodus from Africa, the peopling of the continents, the grand arc of human migration—rests on a single, unexamined assumption: that the branching of mitochondrial haplogroups from L to M and N represents population movement. L is Africa. M and N are the rest of the world. This is the great divide, the moment when humanity left the mother continent and scattered across the globe. But what if the divide is not a geographical event, but a social one? What if it records not the movement of people, but the fragmentation of kinship networks—the moment when marriage alliances shifted, when women began marrying beyond their immediate kin groups, when the social structures of early humanity diversified?
The mutations that define the split between L and M and N are all in the non-coding, hypervariable regions of the D-loop—biological silence, genetic noise, mutations that change nothing about the individuals who carried them. They are empty cargo, freighted with meaning by researchers who assume that genetic similarity equals population continuity and genetic difference equals population movement. But there is no reason to believe that the L to M to N branching records migration. It could just as easily record the breakup of a kinship network—the moment when a single population, speaking a single language, practicing a single set of marriage customs, began to fragment into daughter groups with different social structures. The genetic differences would be identical. The inference would be entirely different.
We have confused the shadow for the substance. We have taken mutations that mean nothing—that have no biological significance, no phenotypic effect, no functional consequence—and woven them into a narrative of human destiny. The great divide is not a population movement. It is a social transition, encoded in the biological emptiness of the non-coding regions, waiting to be misread by researchers who mistake social structure for biological movement.
The Age of Conception: When Maternal Age Rewrites Human History
Here is the uncomfortable truth that the molecular clock cannot escape: mtDNA mutations are not a steady, silent tick-tock of evolutionary time. They are influenced by the age of the mother at conception. Studies have demonstrated that the number of heteroplasmic mtDNA mutations in offspring correlates with maternal age, with older mothers passing on more mutations than younger mothers. This is not a subtle effect; it is a biological reality that introduces a confounding variable of the highest order into every molecular clock calculation. If a woman conceives at 20, she passes on a certain number of mutations. If she conceives at 40, she passes on more. The difference is not trivial—it can shift the apparent timing of a divergence event by thousands of years.
Now extrapolate this to the great divide: L to M to N, the sacred narrative of humanity’s exodus from Africa. The assumption is that these lineages branched at a specific moment in deep time—around 65,000 years ago—when a small group of modern humans left the continent and began their global dispersal. But what if the branching reflects nothing more than variation in maternal age across different populations? What if a population with older mothers accumulated mutations faster, appearing to “diverge” earlier in phylogenetic time, while a population with younger mothers appeared to “diverge” later? The genetic signal would be identical. The inference would be entirely different.
We have built the entire narrative of human migration on a clock that we know is influenced by maternal age, a variable we cannot reconstruct from ancient DNA and rarely even model in our simulations. The great divide between L and M and N may not be a migration at all. It may be a demographic artifact, a record of who had children when, a social signal encoded in the non-coding regions of the mitochondrial genome, waiting to be misread by researchers who assumed the clock was steady and the mutations were neutral. The ages of the mothers are lost to history, but their genetic echoes—the mutations they passed on—remain, and we have mistaken them for the footsteps of a great migration.
The Geographic Paradox: When mtDNA Links the Distant and Confuses the Data
A single woman, carrying her mother’s mtDNA, could travel thousands of miles through marriage alliances, trade networks, or simply a long walk. Her descendants—hundreds of generations later—could be scattered across an entire continent, all sharing her lineage, all “belonging” to the same haplogroup, but with no geographic concentration whatsoever. This is not a hypothetical. This is the documented reality of human history: women have always moved, through exogamy, through capture, through alliance, through trade. The mtDNA they carried was a passenger, not a driver.
The consequence for the data is devastating. When researchers find a cluster of haplogroup H in Europe and a similar cluster in the Middle East, the assumption is that the lineage moved from point A to point B—that a population migrated. But the same pattern could emerge from a single woman who married out of her group 10,000 years ago, and whose descendants simply happened to thrive in both regions through separate, unrelated branches. The genetic linkage is real; the geographical inference is fiction. The data link people who are geographically distant but genealogically related, and in doing so, it creates a mirage of continuity where none exists.
The Circular Logic of Reference Populations
Here is the uncomfortable truth that the ancestry industry would prefer you not examine too closely: the reference populations against which your mtDNA is compared are themselves constructed from modern individuals who self-identify with a particular geographic or ethnic label. A person in Iceland who believes their family has been there for generations provides a blood sample, and that sample becomes “Icelandic reference data.” A person in Nigeria with a similar belief becomes “Yoruba reference data.” The algorithm then compares your non-coding, hypervariable region mutations to these databases and produces a tidy pie chart: “You are 42% Scandinavian.”
But this is not science. It is a feedback loop.
The reference populations are not objective biological categories. They are social constructs—collections of individuals who, for reasons of identity, geography, or historical accident, have been assigned to a group. The mutations that distinguish these groups are in non-coding regions, the biological wastelands of the genome that have no phenotypic significance. The groups themselves are defined by self-identification, not by any inherent biological reality. And then, having constructed these categories, the ancestry companies use them to tell you who you are.
This is the great circularity: we define groups by social criteria, we sequence their biologically meaningless non-coding mutations, and then we use those mutations to assign individuals to the groups we defined in the first place. The result is not a discovery. It is a confirmation of our own assumptions. The algorithm will tell you that you are “Scandinavian” because it has been programmed to recognize mutations that were identified in a sample of self-identified Scandinavians, who were selected by researchers who believed they represented a distinct population, which they defined by criteria that had nothing to do with genetics.
The accepted historical accounts are baked into the data from the beginning. The “Out of Africa” narrative, the “Neolithic transition,” the “Steppe invasions”—these are not conclusions derived from the data. They are assumptions that shaped the data. Reference populations are chosen based on historical narratives about where populations “should” be. The mutations that distinguish them are labeled according to those narratives. And then the narratives are “confirmed” by the very data they constructed.
This is not discovery. It is confirmation bias dressed in the language of science. And the consumer, with their neat pie chart, is none the wiser.
The Way Forward: Abandoning the Metaphor
The solution is not more data. The solution is better theory and better structuring of data.
Bajić and colleagues have shown us the path: “phylogenetically meaningful algorithm-based secondary haplogroup groupings” such as “macro-haplogroups,” “meso-haplogroups,” and “micro-haplogroups,” defined using TreeCluster. This would “foster reproducibility across studies, provide a grouping standard for population-based studies, and reduce errors associated with haplogroup nomenclatures”.
But standardization of nomenclature is not enough. We must also standardize our interpretive framework. We must stop treating mtDNA as a proxy for population movement and start treating it as a proxy for social structure—marriage patterns, kinship systems, alliance networks, and status hierarchies.
The question is not “who moved where?” The question is “who married whom?” The answer to the second question is encoded in mtDNA. The answer to the first is not.
Until we abandon the biological metaphor and embrace the social one, we will continue to tell stories about human history that are elegant, compelling, and wrong.
The Lie and Its Consequences
The mtDNA lie is not that the data are fabricated. The data are real. The lie is the interpretation—the assumption that a maternal genetic marker tells us about population movement rather than social structure (Real Housewives of Babylon).
The lie has consequences:
It misrepresents human history, replacing complex social dynamics with simplistic demographic waves.
It undermines scientific reproducibility, as arbitrary groupings produce arbitrary results.
It obscures the true drivers of genetic diversity, which may be marriage practices, not migrations.
The lie persists because it is convenient. It is easier to tell a story of invasions and replacements than to grapple with the messy reality of kinship, alliance, and social change. It is easier to sequence DNA than to understand the social structures that shaped its distribution.
But convenience is not truth. And the time has come to call the lie by its name. If migrations are primarily socially oriented (driven by kinship, alliance, or status) rather than biologically oriented (driven by climate, resources, or population pressure), it doesn’t just tweak the models—it inverts the causal logic underpinning aDNA interpretation.
Here are the deep, field-undermining inferences:
1. “Steppe Ancestry” Becomes a Social Signal, Not a Demographic One
Current Assumption: The massive spread of Steppe ancestry into Europe (~3000 BCE) indicates a large-scale population replacement via migration.
Social Inversion: If migration is social, that Steppe ancestry could represent elite emulation or bride-exchange networks, not a demographic wave. A small, high-status group could introduce Steppe mtDNA (e.g., U5) into local populations without major population movement. The genetic signal would look identical, but the inferred population history would be entirely wrong.
2. The “Replacement” Model Collapses into “Acculturation” Model
aDNA studies often infer replacement when a new haplogroup appears abruptly.
Social Counter: If women are exchanged as part of alliance-building, new mtDNA lineages can appear without any male migration or population replacement. The local population’s genetics change, but the people (in a biological sense) remain the same. This breaks the link between genetic turnover and demographic turnover.
3. We Misinterpret Time-Transgressive Patterns
Current Assumption: Gene flow is a function of geography and time (isolation-by-distance).
Social Inversion: Gene flow becomes a function of social distance—kinship, rank, or marriage rules. Two populations that are geographically distant but socially connected can show more genetic similarity than neighboring groups. This undermines spatial-temporal models that assume a simple decay of genetic distance with geographic distance.
4. The Paleolithic/Neolithic Transition Gets Redefined
The transition to farming is typically modeled as a demic diffusion (farmers replacing hunter-gatherers) or cultural diffusion (ideas spreading).
Social Inversion: If migration is social, the transition could be driven by matrilocal or patrilocal shifts. For example, if early farmers practiced patrilocality (women move to the man’s group), the mtDNA of hunter-gatherer women would continuously be absorbed into farming groups, producing an apparent “mixed” population that is actually just farmers incorporating wives. The “Neolithic package” spreads not as people or ideas, but as a social structure.
5. We Can’t Distinguish “Invasion” from “Incorporation”
aDNA studies are particularly prone to inferring invasions when a new genetic type appears with archaeological evidence of violence.
Social Counter: Both invasion and incorporation can produce the same genetic turnover. The difference is purely social, not genetic. Without independent archaeological evidence of social organization (e.g., kinship symbols, status goods), we cannot tell them apart.
6. The “Father of the Field” Problem
Much of paleogenetics is built on the work of male archaeologists who assumed male-centric migration (the “warrior hypothesis”).
Social Inversion: If migration is socially negotiated by women (through matrilocality or female exogamy), then the entire field’s foundational assumptions are gendered, and many of its most famous results (e.g., the Indo-European “expansion”) are epistemically circular.
7. The Selection Fallacy: When Biology Becomes a Social Artifact
If mtDNA mutations occur in non-coding, hypervariable regions that have no phenotypic value,— and the mutations themselves are due to age variation and not biological adaption then the very concept of selective pressure on these lineages becomes a biological impossibility. Selection acts on function. It acts on traits. It acts on phenotypes that influence survival and reproduction. The D-loop mutations that define haplogroups—the transitions, the substitutions, the silent changes that accumulate in the biological wasteland of the non-coding regions—do nothing. They change no protein. They alter no function. They confer no advantage. They impose no disadvantage. They are genetic noise, drifting through populations like dust in the wind, entirely indifferent to the forces of natural selection.
And yet, the field speaks of selective pressures.
The assumption, when a haplogroup expands, is that it must have conferred some advantage—perhaps in metabolism, perhaps in cold adaptation, perhaps in fertility. But this is a category error. If the mutations in question are biologically inert, they cannot be the substrate of selection. The expansion of a haplogroup is not a biological phenomenon; it is a demographic phenomenon, driven by social structure, not by biological fitness. A lineage expands because the women who carry it have more surviving children—but that could be due to social status, marital alliances, or simply chance, not because their mtDNA makes them biologically superior.
This is the selection fallacy: the assumption that any genetic lineage that becomes more common must have been favored by natural selection. But if the genetic marker is functionally silent, selection cannot act on it. The expansion is a social signal, not a biological one. It records who married whom, who had status, who had access to resources—not who had better mitochondria.
The implication is field-upending. If we cannot infer selection from mtDNA patterns, then we cannot infer adaptation, fitness, or biological advantage. We cannot reconstruct the “survival of the fittest” from the distribution of haplogroups. We cannot tell stories of populations out-competing each other, of cold-adapted lineages sweeping across continents, of metabolic advantages driving migrations. All we can infer is social structure—marriage patterns, kinship networks, and the stochastic whims of demographic history.
The selection narrative is a ghost story we have told ourselves, a way to impose biological meaning on social phenomena. The truth is far less heroic: mtDNA is not a record of who was strongest, fastest, or smartest. It is a record of who married whom, and who happened to have daughters. And that, stripped of the heroic narrative, is a far more modest, and far more honest, account of human history.
The Pokémon GO Playbook: Why DNA Companies Perpetuate the mtDNA Lie
The Mapping of the World Through Play
In 2016, Niantic released Pokémon GO, a mobile game that required players to physically walk through their neighborhoods, parks, and cities to capture virtual creatures. Within months, the company had amassed a detailed, real-time map of pedestrian traffic patterns across the globe—data on where people walked, when they walked, and how they moved through public spaces. Players thought they were catching Pikachu. In reality, they were labourers in a vast geographic data-collection enterprise, trading their physical movement for entertainment.
The insight is simple: make data collection feel like self-discovery, and people will pay you for the privilege of providing it.
The DNA Company Playbook
Now consider the ancestry industry. 23andMe, AncestryDNA, MyHeritage—they have perfected the same model. Consumers pay $99–$200 to “discover their roots,” to “find out where they’re from,” to “connect with their ancestry.” They spit in a tube, mail it off, and weeks later receive a beautifully designed report that tells them they are 42% Scandinavian, 18% Italian, a dash of Ashkenazi Jewish. They feel validated. They feel seen. They feel connected to a grand narrative of human history.
But that report is the Pokémon GO lure.
Just as Pokémon GO players generated valuable pedestrian traffic data while believing they were playing a game, DNA test consumers are generating the most valuable resource in modern biology: a massive, self-identified, geographically-tagged database of human genetic variation. The mtDNA is the hook—the non-coding, hypervariable, biologically meaningless mutations in the D-loop provide a simple, digestible narrative that any consumer can understand. The real product is the data. The real value is the database.
Why mtDNA? Why not the nuclear genome? Why not the protein-coding regions that actually matter?
Because the non-coding regions are cheap. Sequencing the hypervariable regions of the D-loop is inexpensive, rapid, and scalable. It produces a simple, categorical output—haplogroups A, B, C, D, H, U, etc.—that is easy to visualize and impossible to challenge without sophisticated knowledge. A consumer can look at a pie chart and feel they understand their ancestry. They cannot look at a whole-genome sequence and feel the same.
This is the Pokémon GO model applied to genetics: collect valuable data under the guise of consumer entertainment, deliver a simplified narrative that satisfies the customer, and monetize the data indefinitely. The consumer leaves feeling satisfied. The company leaves with a database worth billions. And the underlying science—the complex, messy, uncertain reality of human population genetics—is quietly omitted from the promotional materials.
Consider the value of the database:
Pharmaceutical companies pay for access to genetic information linked to health outcomes.
Academic researchers collaborate with ancestry companies to access population-level data.
Biotech firms use the databases to identify rare genetic variants.
Law enforcement has used consumer DNA databases to solve cold cases.
mtDNA does not record biology— It records social structure and accurately identifies who your maternal cousins are. And while this is a story of our species it not ‘the story’ of our species.